
The Ongoing Decline in the Number of US Public Corporations
Is it significant? And why is it happening?

A blog post by John Jenkins at the invaluable TheCorporateCounsel.net blog alerted me to a blog post at DLA Piper, which in turn alerted me that the SEC created a Statistics & Visualizations page.
The page provides statistics on capital formation, market participants, market activity, and investors, aided by interactive charts, tables, and graphs that reveal key US capital markets trends.
The SEC indicates that the statistics, many of which were last updated on August 12, 2025, will be updated quarterly, semi-annually, or annually, depending on the data type.
There’s a slew of different data sets available and multiple ways of visualizing them.
Jenkin, DLA Piper, and myself were all intrigued by the data on public US companies.
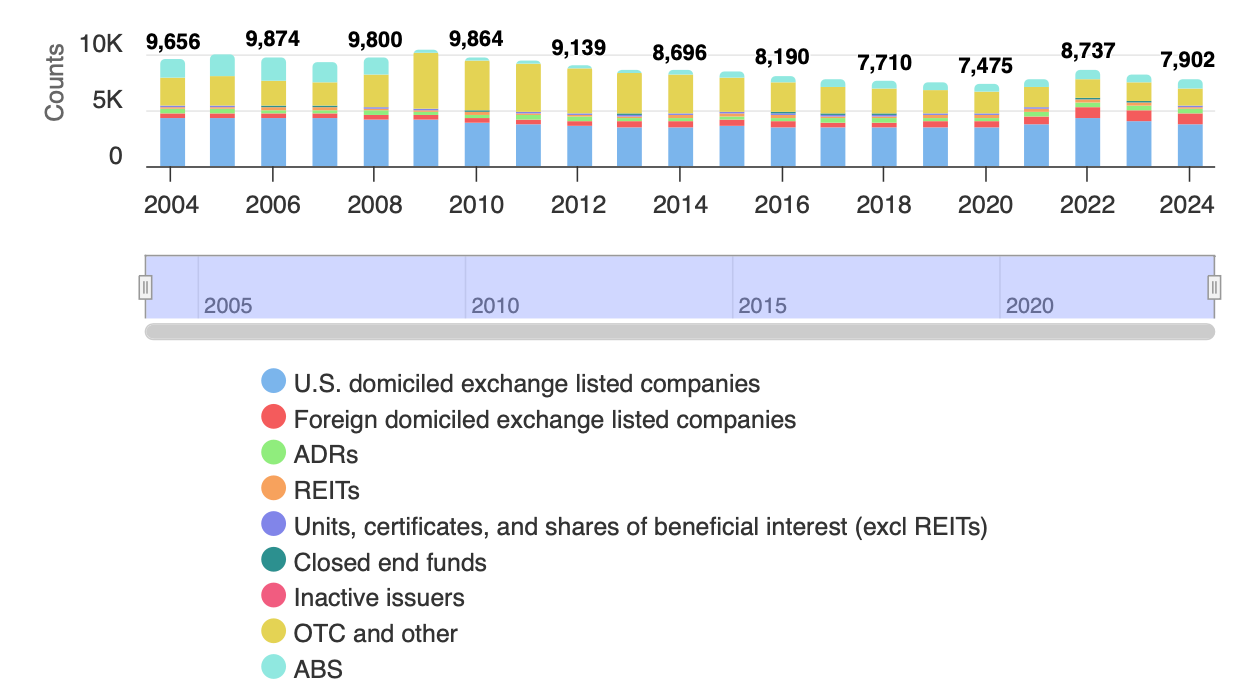
The headline dataset counts the total number of reporting issuers includes all entities that filed an annual report (10-K, 10-KA, 10KT, 10-KT/A, 20-F, 20-F/A, 40-F, or 40-F/A) in the relevant calendar year. It thus includes domestic issuers listed on a US exchange, foreign issuers listed on a US exchange, ADR listings. REITs, closed end funds, OTC traded companies, and companies with registered debt only. The available data covers the years 2004-2024.
Eyeballing the data using the SEC’s visualization tool indicates that the number has steadily dropped:
But is the decline significant? And, if so, what is causing it?
This post would not be complete without a shoutout to my friend and UCLAW colleague Fernan Restrepo. He will understand why.
Keep reading with a 7-day free trial
Subscribe to Bainbridge on Corporations to keep reading this post and get 7 days of free access to the full post archives.